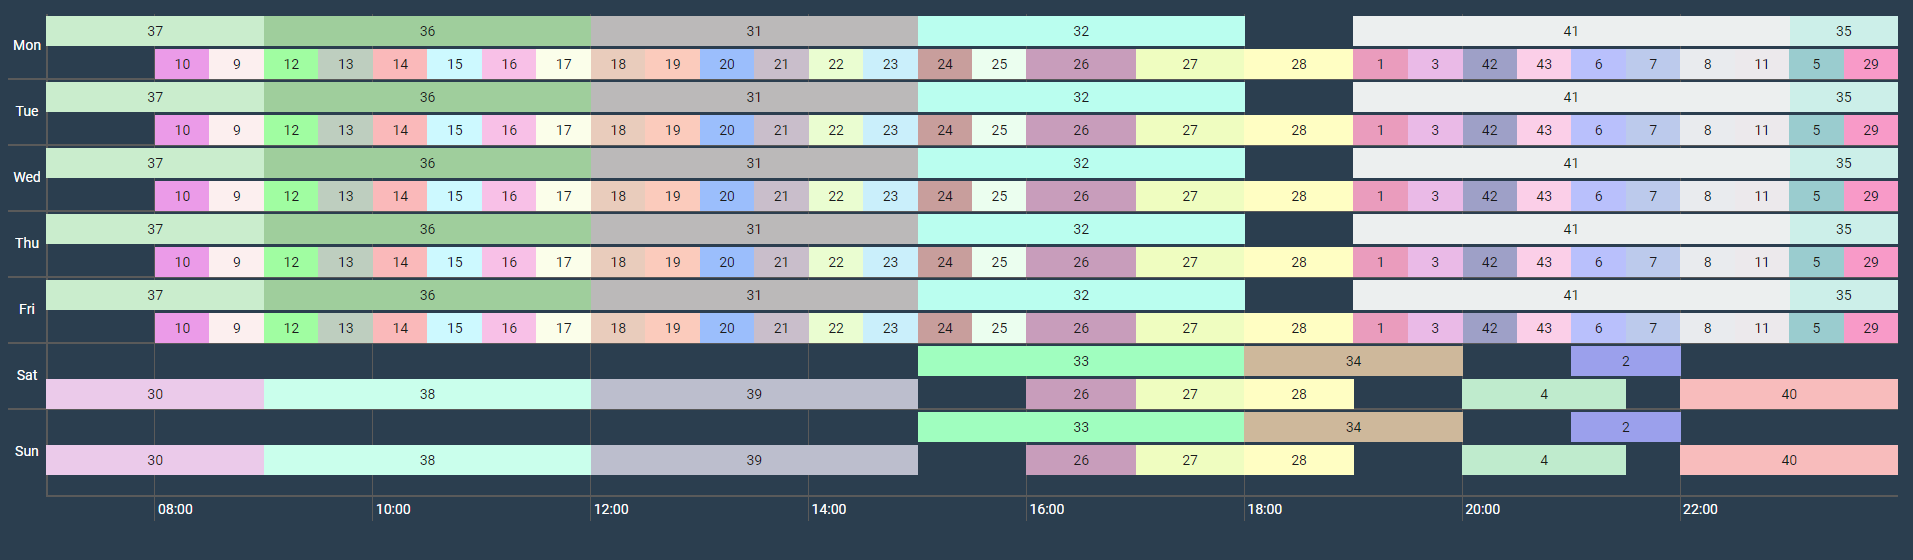
- The graph shows sales units which are currently in the application for the selected channel
- The x-axis shows time of the day
- The y-axis shows the day of the week
- The idea is to know the overlapping pattern of the sales units
- The graph helps in understanding the overlapping pattern of the sales units.
- Two or more sales units at the the same time range are shown using stacked bars.
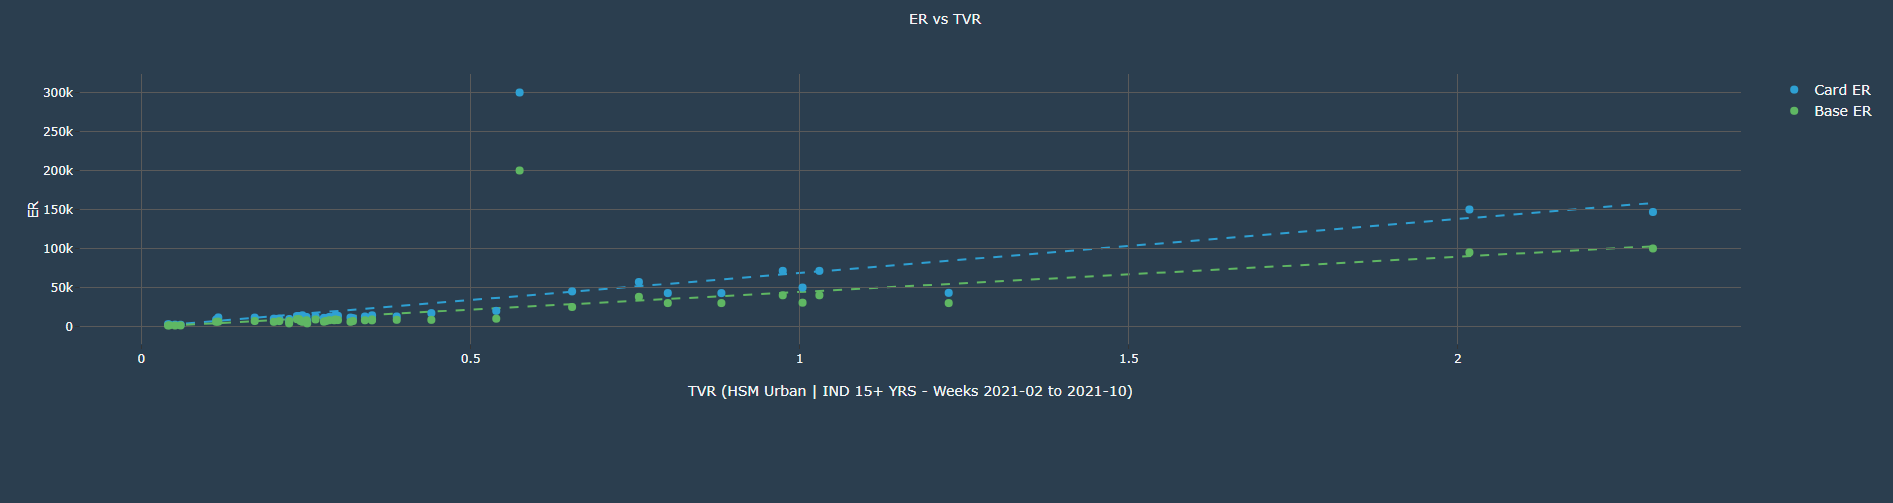
- The graph shows TVR and ER(card and base) of the sales units
- The x-axis shows the TVR of the sales unit
- The y-axis shows the ER value of the sales unit
- The trend line shows how the ER are being distributed among the sales units, which helps in deciding the right ER for the sales unit for a given TVR.
Check Rates
| Issue | Start Time | End Time | Program Name | Dow | Card ER | Base ER | Total Fct | Must Have | Overfill | Available From | Available To | TVR | Ratings | Impressions | Card Cprp | Base Cprp | ER 0 | ER 0.05 | ER 0.1 | ER 0.15 | ER 0.2 | ER 0.25 | ER 0.3 | ER 0.45 | ER 0.5 | ER 0.55 | ER 0.75 | ER 0.9 | ER 0.95 | ER 1 |
|---|---|---|---|---|---|---|---|---|---|---|---|---|---|---|---|---|---|---|---|---|---|---|---|---|---|---|---|---|---|---|
| 10:00 | 11:00 | Ethirneechal | M T W T F S S | 2,900 | 1,250 | 1,440 | 0.00 | 0.04 | 82.7 | 71,495.84 | 30,817.17 | 500 | 1,200 | 1,200 | 1,200 | 1,250 | 1,250 | 1,250 | 1,250 | 1,250 | 1,500 | 2,000 | 2,000 | 2,000 | 10,450 | |||||
| High base ER | 11:30 | 12:00 | Thalattu | M T W T F S S | 2,300 | 1,500 | 1,440 | 0.00 | 0.04 | 86.54 | 54,175.9 | 35,332.11 | 1,000 | 1,155 | 1,200 | 1,200 | 1,250 | 1,250 | 1,250 | 1,500 | 1,600 | 1,800 | 2,000 | 2,000 | 2,000 | 4,500 | ||||
| 11:00 | 11:30 | Magarasi | M T W T F S S | 2,300 | 1,250 | 360 | 0.00 | 0.05 | 104.3 | 44,957.88 | 24,433.63 | 500 | 1,200 | 1,200 | 1,250 | 1,250 | 1,250 | 1,250 | 1,500 | 1,500 | 1,500 | 2,000 | 2,000 | 2,000 | 10,450 |