Scatter Grid
Create Proposal
View Proposal
LA Grid
Inventory
View Proposal
Make Goods
Make Goods Brand
Timeband Definitions
Inventory
Sales Units
Rate Calendar
Demand Forecast
Missing Mapping
Visualizer
Ad Revenue
FPC
Sales Units
ER Comparison
Grid Comparison
Indexing
BMS ER Comparison
Committed Inventory
Post Eval
Ratings
BARC - BMS Map
Post Eval Report
Dispute Spots Report
Client Mapping
Unmappped Client
R1
Role Management
System Preference
Logout
Demand Forecast
Channel
KTV
SUN TV
SUN Life
Select Category
RODP/Spot Buy
Large/Scatter
RODP/Spot Buy & Large/Scatter
By Timeband
By Program
Refresh
DOW
*
All
Mon-Fri
Sat-Sun
Mon-Sat
Mon
Tue
Wed
Thu
Fri
Sat
Sun
Start Time
*
End Time
*
By Program
Select
Program Name
Start Time
End Time
DOW
No. of shows
SUN TV
10:10
13:00
M
T
W
T
F
S
S
1
SUN TV
13:05
15:00
M
T
W
T
F
S
S
1
SUN TV
13:15
14:45
M
T
W
T
F
S
S
1
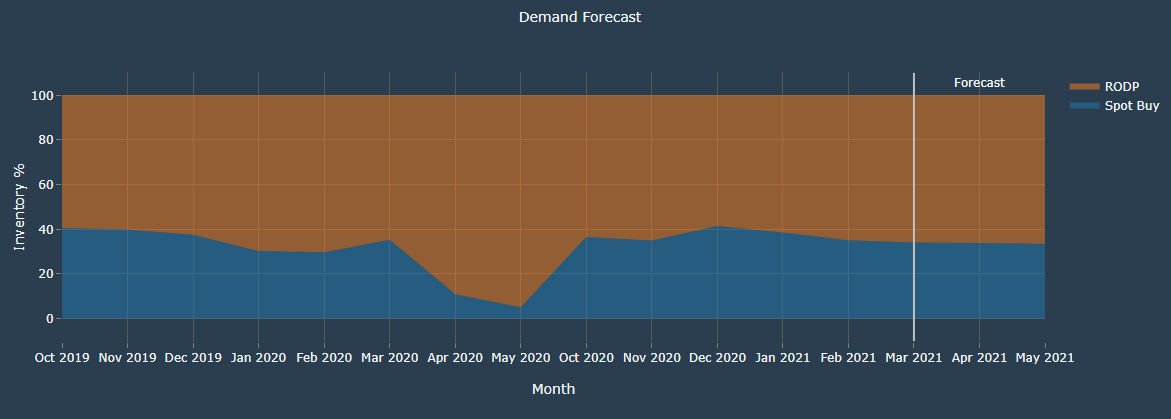
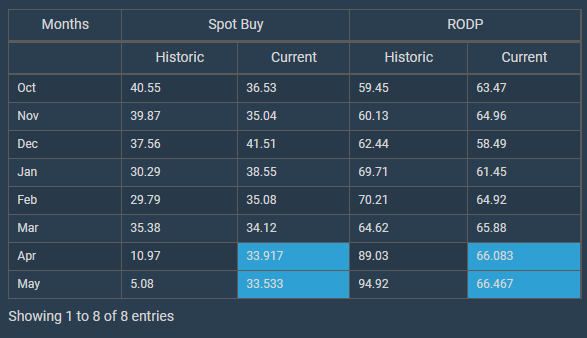
The graph shows forecast of the demand for upcoming months
The x-axis shows the months
The y-axis shows the inventory usage(in percentage)
The graph helps to understand the trend in the inventory usage over the past months and make appropriate forecast for the future.
The white line(annotated as forecast) seperates the forecast values from the historic values.